
How Marple DB achieves top-of-market ingestion speed
Marple DB is incredibly fast at batch ingestion for data coming from files such as MDF, MAT, TDMS, ... In this post, we take a technical look on what is driving this performance at the core.
.png)
More time series data is being collected than ever before. Over the past years, engineers are putting more sensors on their prototypes, and are logging at ever higher frequencies. This makes sense, because you want to avoid redoing a test or test campaign because some values are missing in the recordings.
The only downside is that your tooling needs to keep up with these massive amounts of data. That’s why our primary design goal for Marple DB is to have the fastest available batch importing for time series data. Here’s a peek behind the scenes on how we achieve this.
The challenge: Making measurement files queryable
High-performance logging systems typically write to measurement files like MDF, MAT, TDMS, ULOG and many more. Most of these file types have high compression rates, taking a small amount of disk space for a large amount of collected data. Here are some example use cases that we have seen:
In this table, every pair of (time, value) for 1 measurement (e.g. “temperature”) is counted as 1 datapoint.
Each file format has a different approach on how it encodes the measurements. Two examples of extremes at each side of the spectrum are MDF and CSV. In CSV, simple UTF-8 or ASCII encoding is used, and data is often represented on 1 shared time axis. In a previous blog post, we actually argued that CSV is not such a bad choice, despite it’s obvious limits.
.png)
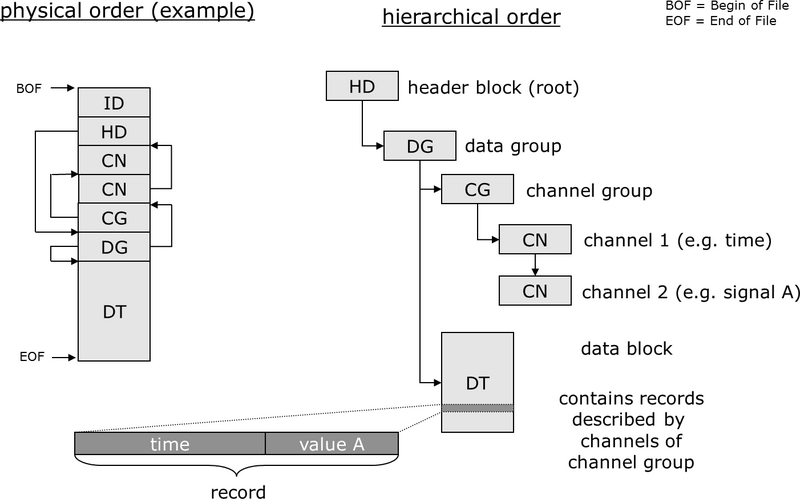
MDF on the other hand, has a complex structure with different block types, splitting channels in multiple groups, each with a separate time axis.
Modern engineering teams want to make these files queryable in a database-like environment, to enable standardised workflows, and open up the possibility for data mining & AI use cases. But achieving this with traditional available databases is very hard.
Let’s take a naive approach and try to import a 3.6 GB MDF file from the example use case above into PostgreSQL. At 100k rows / second, this would take 53 hours to ingest a single file on 1 instance. Counting 90 bytes / datapoint, this would take 1.7 TB of space (costing roughly $2811 / year of RDS gp3 storage on AWS). Now imagine having 15 files like this every day. That is not scalable, so clearly a different approach is needed.
Taking control of file parsing
Typically, databases expect users to handle the data input themselves. In this case, that means parsing the raw measurement files. An engineer needs to write custom scripts to open the files, extract channels, and metadata and push data through the available API from the database. Taking into account the challenging file sizes mentioned above, these quick-and-dirty scripts usually blow up RAM of the user’s computer, and are slow.
On Marple DB, the database takes control of this process. It includes a plugin-based file parsing system to achieve this. For each file type, we have a separate plugin, covering MDF, MAT, TMDS and other common telemetry data file types. Among other things, plugins are designed to do:
- RAM control (limiting): Processing data in chunks instead of loading the whole contents into memory
- Data partitioning: Grouping measurements with a common time base together, and writing those to Arrow files. This makes parallel writes possible in the next step (see below)
- Metadata extraction: Both on channel level (e.g. units, sampling frequency) and on dataset level
To improve and debug plugins, we are of course using our own Marple products! Below is a graph of the RAM consumed by the plugin while importing a 2.8 GB MDF file. It maxes out at ± 5 GB RAM (purple line), compared to ± 100 GB RAM which would be used when naively taking the whole file contents in memory:
.png)
Debugging Marple DB plugins using our own Marple products. open_files are the number of open file descriptors on Arrow files, which act as partitions on the decoded data by the plugin.
We run these plugins in sandboxed environments, which decouples potential plugin crashes from main database software. Additionally, this allows us to assign a maximum amount of RAM to a plugin using setrlimit.
Within a certain file format, not every file is structured exactly the same. To overcome this, plugins take optional command line arguments, for example:
./tdms_plugin.py --time-col "Time Channel" --unit "si_unit"
Our plugin documentation contains a list of all available plugins and their options. For users with self-invented file formats, or unique edge cases, we allow customising the actual plugin code.
Parallelising writes to cold storage
Most traditional databases handle ingestion row by row, which quickly becomes a bottleneck for telemetry data with millions of samples per signal. In our naive example higher up in this post, we calculated that ingesting 19 billion datapoints (from MDF) into a PostgreSQL would take 53 hours, due to the limit of pushing ±100k rows / second.
Marple DB is designed around signal-based ingestion. Instead of treating each sample as an individual row, we treat each signal as a logical unit. For storing the data in its final state, we choose the Apache Iceberg format. We store each signal in a separate parquet file, and use Iceberg’s metadata files to keep track of them. Choosing an open standard like Iceberg means users can query this cold storage with many popular query engines, including Spark, Trino and PyIceberg.
Having separate files for each signal, we can massively increase the throughput by writing in parallel. In our case, we are using S3 object storage, giving us the full scalability of the cloud for our SaaS and VPC Marple DB instances. For self-managed deployments, we use MinIO to have a local object store.
The total data flow from MDF to object store looks roughly like this:
.png)
Marple DB is achieving a throughput of up to 10M datapoints / s using this unique combination of plugins, Arrow files, parquet and object storage. That means that all data from the reference 3.6 GB MDF file is ingested in 30 minutes. This is a 100x improvement over the vanilla PostgreSQL example (53 hours). Let’s have a look at how this compares to other database solutions.
Benchmarking results
To benchmark the Marple DB performance against other solutions, we used a t3.xlarge EC2 virtual machine (4 vCPU, 16 GB of RAM) with a 512 GB network attached SSD. We tested with five reference datasets (MDF, CSV, TDMS, Parquet, ULOG).
For ingesting in other databases than Marple DB, we called their SDKs directly from within our file plugins. We are by no means experts in all of these products to squeeze out the last drop of throughput, but neither are typical end users. Performance is a combination of both inherent properties of a technology, and what people can achieve within reasonable efforts of optimising their scripts.
Therefore, when replicating these tests, you might have slightly different results depending on the exact implementation in your script. For Marple DB on the other hand, performance is a lot more predictable. Ingestion control is taken into the product, out of the user’s responsibility, leaving less space for human error.
Let’s have a look at the results. The throughput is calculated as the average throughput over the whole file import: total_datapoints / total_import_time.
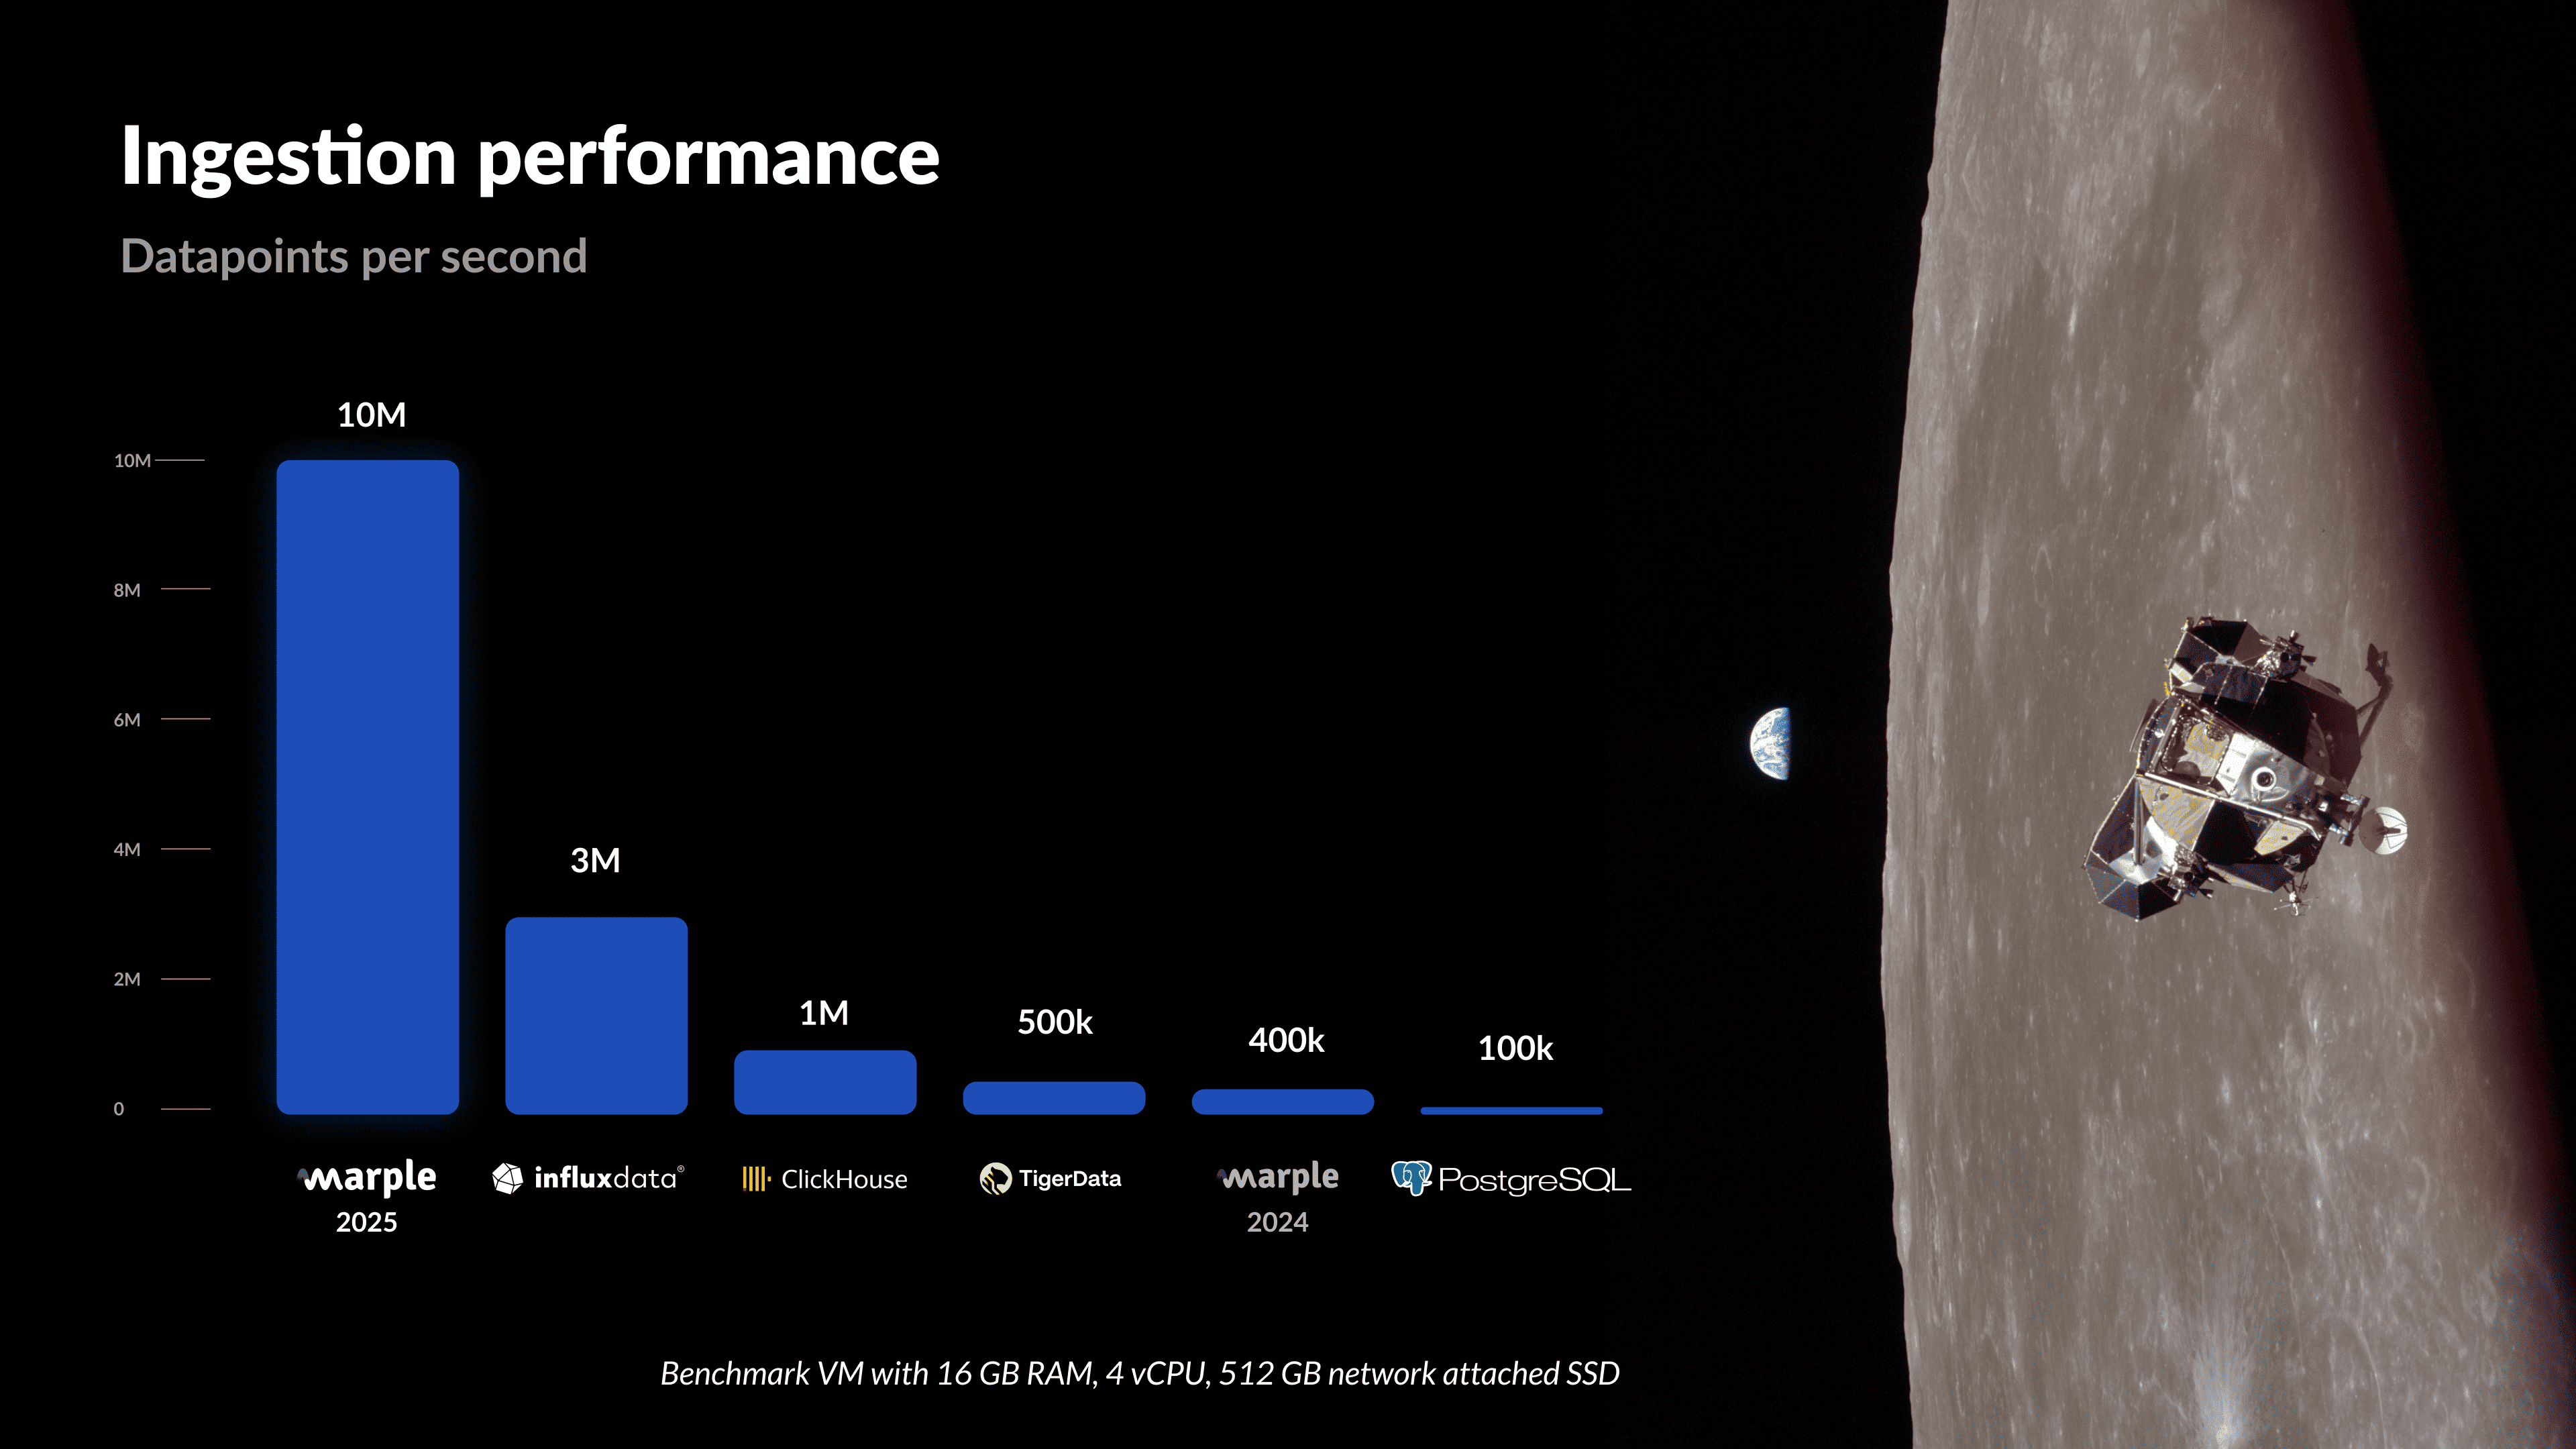
This puts Marple DB well above other database solutions, delivering top-of-market performance for batch ingestion and achieving our primary design goal. And this is just the start. We have lots of design ideas for future releases, so stay tuned for more!
Want to see Marple DB in action? Book a demo or learn more on our website.